Women in leadership roles has come a long way in less than a century. Today, women have worked their way through the ranks of the professional world to represent well over half of the US workforce. Yet, they continue to hold a vastly smaller percentage of leadership positions than men in various sectors.
For women of color, the climb to be equally represented in leadership roles has been even more laggard. While today’s statistics about women in leadership show improvement from years past, there’s much more work to be done.
-
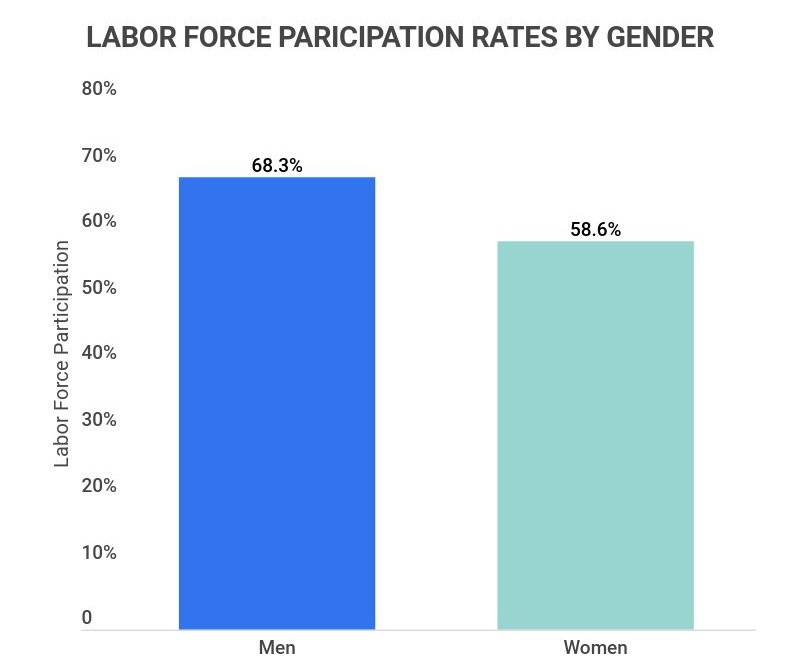
Women represent 58.4% of the US workforce as of September 2022 but only held 35% of senior leadership positions
-
Companies with women executives are 30% more likely to outperform other companies
-
10.4% of Fortune 500 CEOs are women
-
Less than 1% of Fortune 500 CEOs are women of color
-
Women account for 55.75% of first-year law students but only represent 40% of lawyers in the United States as of 2022
-
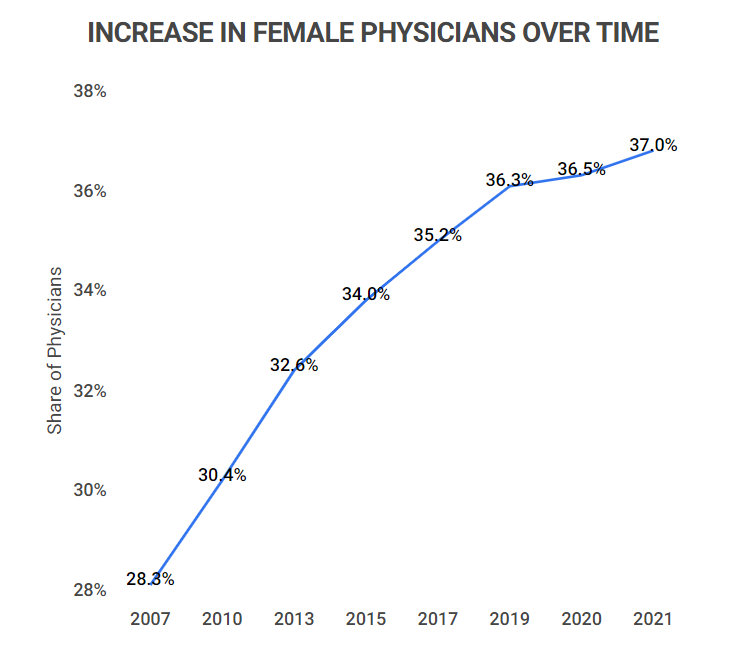
Women represent 56.5% of medical students in the United States but only account for 37% of doctors as of 2022
For further analysis, we broke down the data in the following ways:
Education Level | Corporate Level | Demographics | Trends and Projections

General Women in leadership statistics
Women in leadership positions has been a relatively new phenomenon within the past 50 years. Luckily, even in that short period of time we’ve made strides toward ensuring more women can achieve leadership roles. For more interesting facts, consider these general statistics:
-
35% of top management positions are held by women.
This is despite the fact that women make up more than half of the workforce in the United States as of 2022.
-
As of 2023, women hold 10.4% of leadership positions at Fortune 500 companies.
There are a total of 52 women running businesses on the Fortune 500 list, an all-time high. In 2021, two Black women were running Fortune 500 companies for the first time ever, Roz Brew at Walgreens Boots Alliance and Thasunda Brown Duckett at TIAA.
-
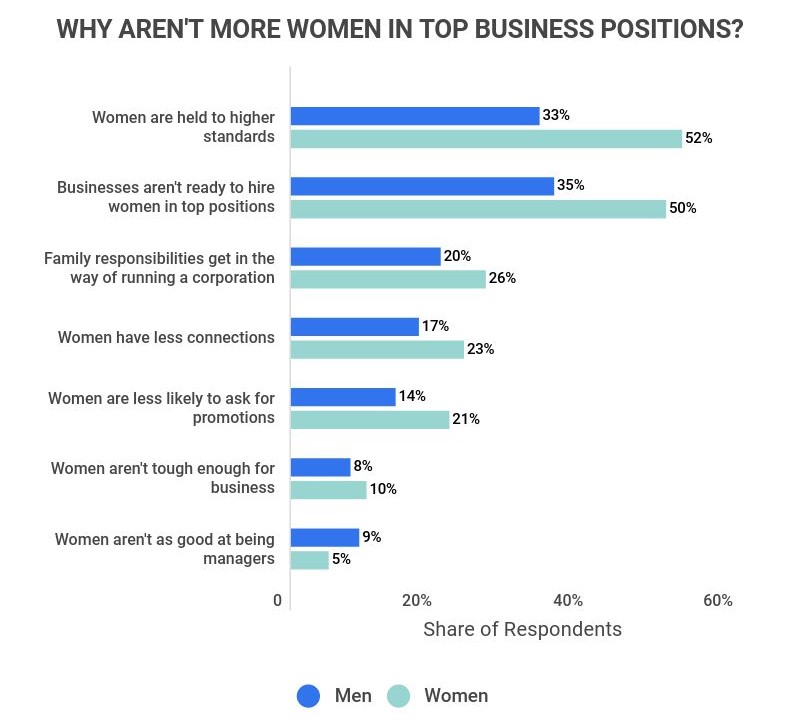
One research study found that the two biggest challenges keeping women from leadership positions are that women are held to higher standards (43%) and many businesses aren’t “ready” to hire women for top executive positions (43%).
Other cited challenges included family responsibilities not leaving enough time for running a major corporation (23%), women don’t have access to the same kind of connections as men (20%), and women being less likely to ask for promotions and raise (18%).
-
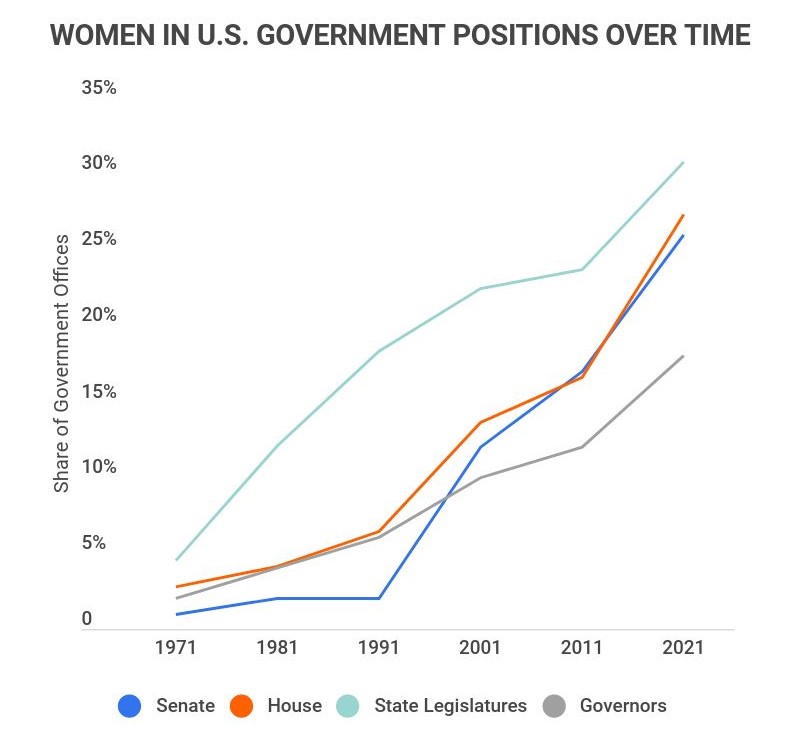
Women make up 27.9% of the 117th United States Congress.
This translates to 147 women out of 535 seats across both the House of Representatives and the Senate. While this is a 50% increase from the previous decade, it’s still far from representing the full percentage of the female population.
Women in the workplace by education level statistics
Women seem to achieve higher levels on education on average when compared to men. Despite this, there are still more men in leadership positions than there are women. To explore this disparity further, here are some interesting facts:
-
41% of women achieve a tertiary (university) level of education compared to 36% of men worldwide.
Both 66% of men and 66% of women around the world complete secondary education (high school). Additionally, 88% of women and 91% of men worldwide finish their primary education.
-
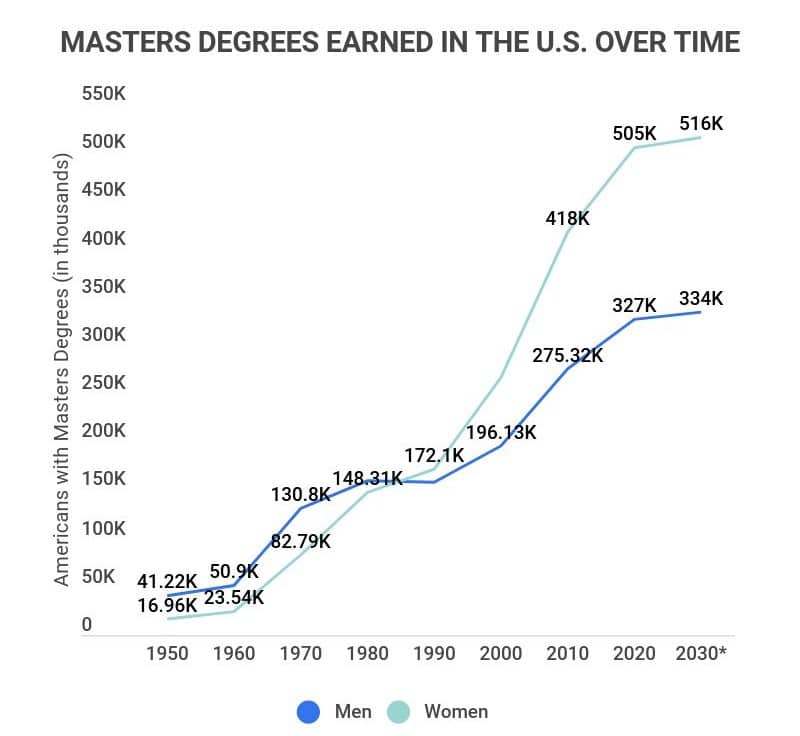
Between 2020 and 2021, women earned 505,000 master’s degrees in the United States. Alternatively, men earned 327,000 graduate degrees during the same period.
This means that women were awarded 60% of all U.S. graduate degrees in 2020.
-
Women earn 51.9% of the PHDs awards in the United States. Representing the 13th year in a row that women had earned more doctoral degrees than men.
For every 100 men earning a doctoral degree in 2020, 113 women did the same thing. While these numbers decreased slightly in 2021, women are still leading in degrees earned.
-
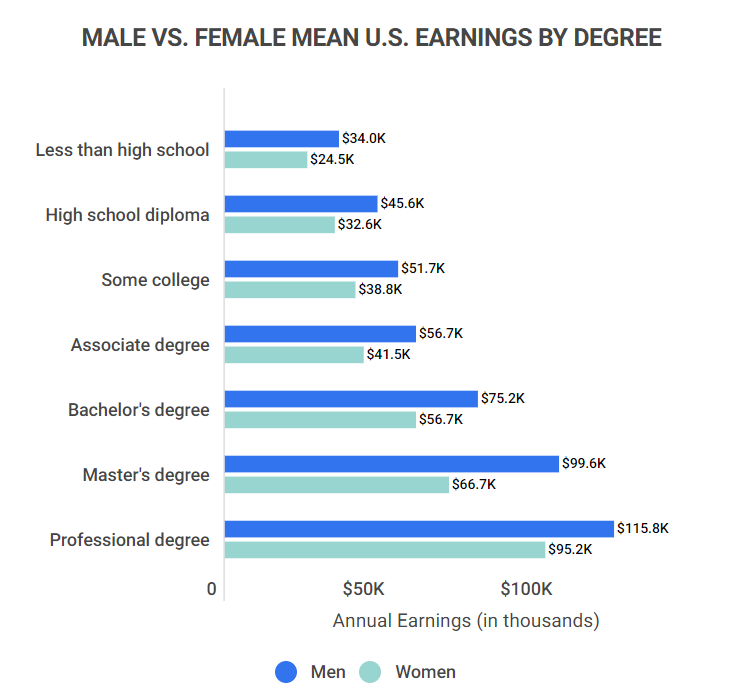
Women who earn a master’s degree have an average salary of $66,700 in the United States, while men who achieved the same level of education earn an average of $99,600.
In other words, men earn 49.3% more than women for having the same qualifications. Men earned more than women with the same educational background at every level of schooling.
Men with less than a 9th-grade education earned an average of $34,000 compared to women who earned $24,500 – a 38.8% difference.
Women in the Workplace by Corporate Level Statistics
Leadership positions at the corporate level are still populated by far more men than women, even after the progress that’s been made thus far. Here are a few facts about women in leadership positions at the corporate level:
-
Women hold 23% of executive positions, 29% of senior management positions, 37% of manager positions, 42% of professional positions, and 47% of support staff positions globally.
-
30% of S&P board directors are women, a record high number.
-
One study found that women represent 5% of top-earners who qualify as ‘the one percent.’
Women in leadership statistics by demographics
Not all women in leadership positions are created equal, as there are still demographic disparities between those in different industries, and those with different skin colors. To dive deeper into the demographic differences between women leaders, here are some essential statistics:
-
The industries with the highest rates of women in leadership include human resources (74.85%), education/social services (41%), healthcare (41%), and hospitality (33%).
Close runner-ups included food and beverage services (27%) and financial services (25%).
-
The industries with the lowest rates of women in leadership include mining/quarrying (12%), construction/real estate (18%), and transport (19%).
Other industries with low rates of women in leadership are manufacturing (19%) and technology (19%).
-
Women represent 56.5% of medical students and 55.75% of law students in the United States; however, they only account for 37% of doctors and 40% of lawyers.
The trend of women accounting for more than half of the students in a higher education program but then receiving only a little more than a quarter of jobs in the field is common among many industries.
-
Representation % by corporate role, gender and race (2021)
White Women 30% 28% 27% 24% 22% 20% Women of Color 17% 12% 9% 7% 5% 4% Men of Color 17% 17% 15% 13% 12% 13% White Men 35% 42% 50% 56% 61% 62% Entry Level Manager Senior Manager/
DirectorVice President Senior Vice President C-Suite
Women in leadership trends and projections
Women in leadership positions has been increasing steadily over time. To show these impressive increases (even if there’s still a long way to go), here are some compelling facts:
-
In 1995, 0% of Fortune 500 CEOs were women, but today 10.4% of Fortune 500 CEOs are women.
-
In 1965, just 2.3% of U.S. representatives were women. As of 2023, 28% of U.S. representatives are women.
-
In 1975, 2% of state governors were women. In 2023, 18% of state governors were women.
-
Increase in the representation of women by level from 2016 to 2021:
Entry Level Manager Senior Manager/
DirectorVice President Senior Vice President C-Suite +2% +4% +3% +1% +3% +5%
Women in leadership statistics FAQ
-
What percentage of women hold leadership positions compared to men?
Women hold 35% of senior leadership positions, compared to men, who represent 65% of all leadership positions. Even though women account for over half of the workforce in the United States.
-
Why is it important to have women in leadership?
It’s important to have women in leadership in order to allow for a variety of perspectives. When mainly men or white Americans are taking control and making all the decisions in business and politics, it eliminates the viewpoint of a huge percentage of the United States population.
51.1% of the U.S. population and 58.4% of the US workforce are women. 41% of Americans are people of color from varying backgrounds. People of color account for approximately 49.2% of the US workforce.
So, why is it that these groups consistently hold a smaller percentage of leadership positions than white men?
Individuals in leadership positions are the ones who have the power to enact real change (or keep up the outdated status quo) in the ecosystem that they’re directing.
It’s impossible to run a fair and inclusive business or country without the equal input of everyone that will be impacted by its implications. That’s why it’s imperative to have women from all different backgrounds in leadership positions.
-
What percentage of executives are women?
23% of executives around the world are women. Alternatively, 29% of senior management, 37% of managers, 42% of professional roles, and 47% of support staff positions are held by women.
In 2020, 30% of S&P board directors were women, a record high number. Additionally, women make up 10.4% of Fortune 500 CEOs. Women of color accounted for less than 1% of Fortune 500 CEOs in 2020, which was still a higher percentage than ever before.
-
What are the main challenges women face in leadership?
The two biggest challenges that keep women from leadership positions are that women are held to higher standards, and many businesses don’t feel “ready” to hire women for top executive positions. The percentage of people who felt that women face these major challenges in leadership was tied at 43%.
The same study also noted the things that people felt weren’t relevant challenges to women in leadership.
These included that women aren’t as good at being managers as men (77% of the poll stated this was not a reason there aren’t more women in top executive positions) and women aren’t tough enough for business (68% of the poll stated this was not a reason there aren’t more women in top executive positions).
Conclusion
Women have forged their way into the professional and political world over the past fifty years. Today, around 54% of the US workforce is female, but it’s still slow-going when it comes to female presence in leadership positions.
While there’s been growth in the percentage of female leaders, they still occupy a drastically smaller percentage of these roles. This rings even more true for women of color.
The Fortune 500 presents a clear example of the glacial pace that female growth leadership is moving. The Fortune 500 is a list put out every year that ranks the top 500 largest United States companies. It basically outlines the biggest and the best American corporations by revenue.
Just under 90% of these esteemed companies are run by men – leaving 10.4% of them run by women in general and less than 1% led by women of color. Even more astonishing is that this is a record-breaking high for female leadership at Fortune 500 companies. That 1%, or two women of color leaders, is the most that any Fortune 500 company has ever seen.
These low percentages are true across much of the corporate world. While white men account for 62% of C-suite roles, white women hold 20%, men of color hold 13%, and women of color only hold 4% of these high-level positions.
There’s also a pretty large discrepancy in the percentage of female higher education students and women who end up actually involved with the professional field. For example, over half of all American medical students are women, but only 37% of doctors are female as of 2022.
This is true of the legal realm as well, in which 55.75% of first-year law students are women, but only 40% of lawyers end up being female.
While record-breaking improvements have been made in female leadership, the magnitude of these developments shows that there’s much more work to be done before the playing field is leveled.
References
-
U.S. Department of Labor. Labor Force Status of Women and Men. Accessed on January 29, 2022
-
CEO World. Women in business: The percentage of women in senior management positions increased in 2021 worldwide – CEOWORLD magazine. Accessed on January 29, 2022
-
McKinsey. Delivering through Diversity. Accessed on January 29, 2022
-
Women Business Collaborative. Women CEO Report – Women Business Collaborative. Accessed on January 29, 2022
-
AAMC. Nation’s physician workforce evolves: more women, a bit older, and toward different specialties | AAMC. Accessed on January 29, 2022
-
Catalyst. Women in Law (Quick Take) | Catalyst. Accessed on January 29, 2022
-
Statistica. US: share of lawyers by gender 2020 | Statista. Accessed on January 29, 2022
-
Pew Research. Obstacles to Female Leadership | Pew Research Center. Accessed on January 29, 2022
-
Pew Reseach. A record number of women are serving in the 117th Congress | Pew Research Center. Accessed on January 29, 2022
-
Statistica. Educational attainment worldwide 2020, by gender and level. Accessed on January 29, 2022
-
Statistica. Master’s degrees earned in the United States by gender 1950-2030. Accessed on January 29, 2022
-
AEI. Women earned the majority of doctoral degrees in 2020 for the 12th straight year and outnumber men in grad school 148 to 100 | American Enterprise Institute – AEI. Accessed on January 29, 2022
-
Statistica. Mean earnings in the U.S. 2020, by educational attainment and gender. Accessed on January 29, 2022
-
Catalyst. Women in Management (Quick Take). Accessed on January 29, 2022
-
Catalyst. Women on Corporate Boards (Quick Take) | Catalyst. Accessed on January 29, 2022
-
Sage Pub. Women in the One Percent: Gender Dynamics in Top Income Positions – Jill E. Yavorsky, Lisa A. Keister, Yue Qian, Michael Nau, 2019. Accessed on January 29, 2022
-
McKinsey. Women in the Workplace | McKinsey. Accessed on January 29, 2022
-
Forbes. Which Industries Have The Most Women In Senior Management? [Infographic]. Accessed on January 29, 2022
-
Pew Research. The Data on Women Leaders | Pew Research Center. Accessed on January 29, 2022
-
US Census. US Census Bureau QuickFacts: United States. Accessed on January 29, 2022
-
Visual Capital. Mapped: Visualizing the US Population by Race. Accessed on January 29, 2022
Author
Sky Ariella is a professional freelance writer, originally from New York. She has been featured on websites and online magazines covering topics in career, travel, and lifestyle. She received her BA in psychology from Hunter College.